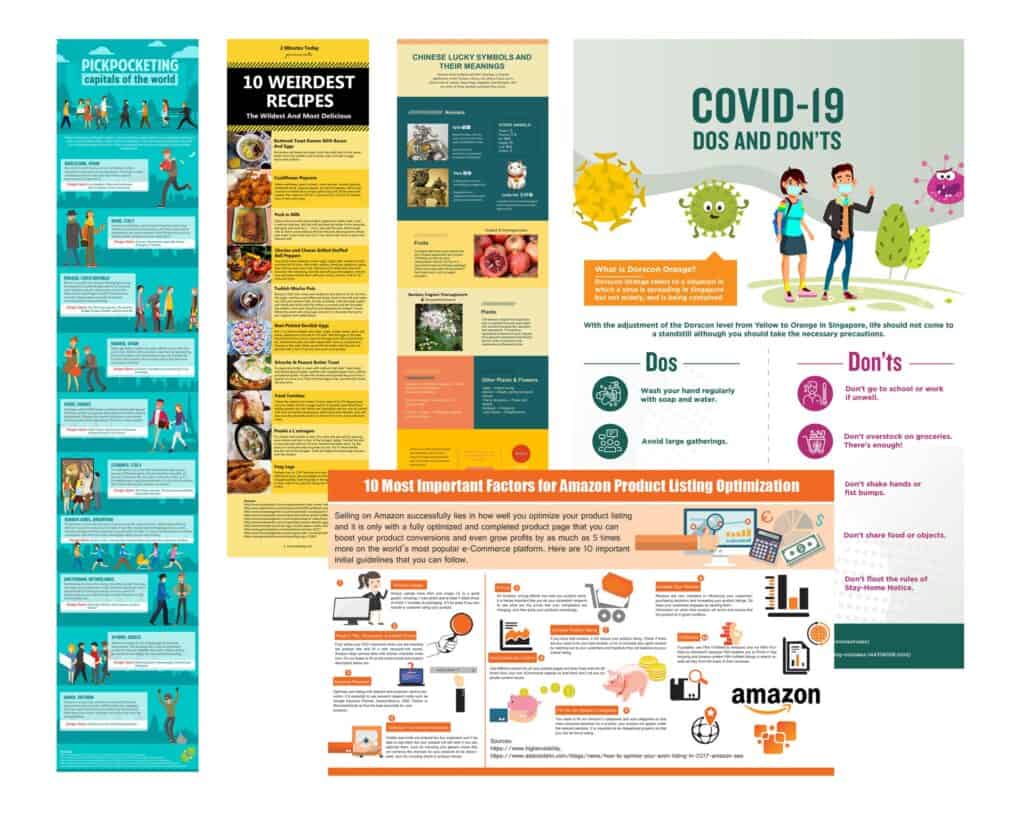
Infographic Marketing
Transform complex ideas into captivating visuals that drive engagement.
High quality infographics are not only visually engaging but also one of the most effective methods for link building from an SEO perspective. Creating infographics for SEO reasons can generate more genuine backlinks than any other link building techniques online. A well-planned infographics strategy, when executed together with other forms of content, will facilitate higher ranking in search engines such as Google and AI engines such as ChatGPT, and increase relevant traffic to your website, hence bringing in more leads and conversions.
Infographics can also help to establish your brand as an authority in your industry. By creating well-researched and visually appealing infographics, you demonstrate your expertise and credibility to potential customers and clients. This can lead to increased trust and ultimately more business opportunities.
Businesses are increasingly using infographics to communicate complex information in an easy-to-understand format. By using clear and concise visuals, infographics can convey information more quickly and effectively than text alone. This is particularly helpful in industries that deal with technical or complicated information, such as science, finance, or technology.
Infographics are also easily shareable and maintain their relevancy over time. You can also break up your infographics into bite-sized posts for social media, or even reuse the data, charts, graphs and tables in other blog posts.
Overall, incorporating infographics for SEO strategies can have numerous benefits for your business. From link building to brand awareness, infographics are a versatile and effective tool for driving traffic and conversions.
Types of Infographics

There are many types of infographics that we can create, and here are some of the more popular ones.
1. Statistical Infographics
Statistical infographics, which usually use charts and graphs such as bar charts, line graphs and pie charts to visually represent data, are powerful tools for presenting information and making comparisons, often incorporating data and numerical figures. The overall style and design of this kind of infographic should aim to help viewers understand the data and derive meaning from it. This makes them particularly useful in fields such as business, finance, social science, and research.
2. Timeline Infographics
Timeline-based infographics, which typically use a linear approach to illustrate the development of events across time, are effective visual representations of historical events and significant turning points in a process, such as a company’s history, the evolution of technology, or the timeline of a significant historical event. The timeline format allows for easy visualisation of the sequence of events and their corresponding dates, helping viewers to understand the progression of the subject matter.
3. Informational Infographics
Informational infographics are an effective tool for simplifying and presenting complex ideas or processes in a visually engaging format, especially with regard to a particular topic or issue, and can combine text, images, and icons to convey information. They are used in various industries, such as research, health, and education, to help simplify difficult concepts and make them more easily understood.
4. Interactive Infographics
Interactive infographics allow users to engage with the content by clicking or hovering over different sections. These infographics can be used to create interactive timelines, quizzes, and other engaging content that can captivate the audience.
5. Animated Infographics
The above infographics can all be made into animated infographics, which use motion graphics to make information more visually appealing and engaging for viewers. This type of infographic can present animated graphs, charts, or other visual elements that are used to explain complex concepts or processes. By adding movement and interactivity to the design, animated infographics can help hold the viewer’s attention and make it easier for them to understand the information being presented. This type of infographic can be used across a wide range of industries and applications, from marketing to education to research.
Get Started Here!
Elevate your content and bring your business to the next level with infographic marketing. Get in touch with me at +65-9622-8824 or bei@beithoven.com for a discussion about your infographics strategy. For other types of visual content, find out more here.
Skyrocket Your Results with Giant Infographics
- Other Fun Stuff
[Digital Download] ‘Timeline of Chinese Dynasties’ Digital Print
$10.90 Add to cart Buy NowRated 0 out of 5 - Content Catalyst System
[Digital Download] ‘128 Photography Prompts for AI Image Generation’ Digital Marketing Print
$10.90 Add to cart Buy NowRated 0 out of 5 - Content Catalyst System
[Digital Download] ‘128 Art Styles for AI Image Generation’ Digital Marketing Print
$10.90 Add to cart Buy NowRated 0 out of 5 - Marketing Posters
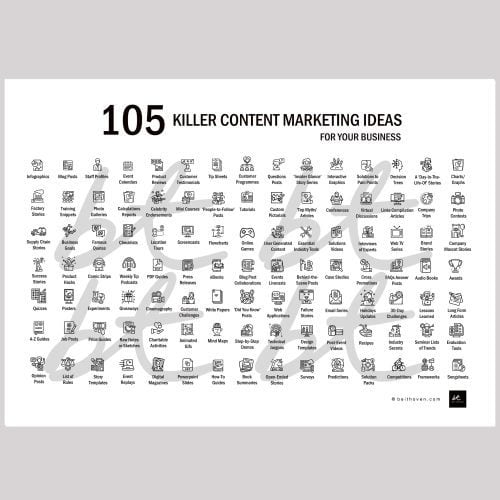
[Digital Download] ‘105 Killer Content Marketing Ideas for Your Business’ Digital Marketing Print
$10.90 Add to cart Buy NowRated 0 out of 5


